Tyres… The Big One. (Part II) – tTool & Batch Testing
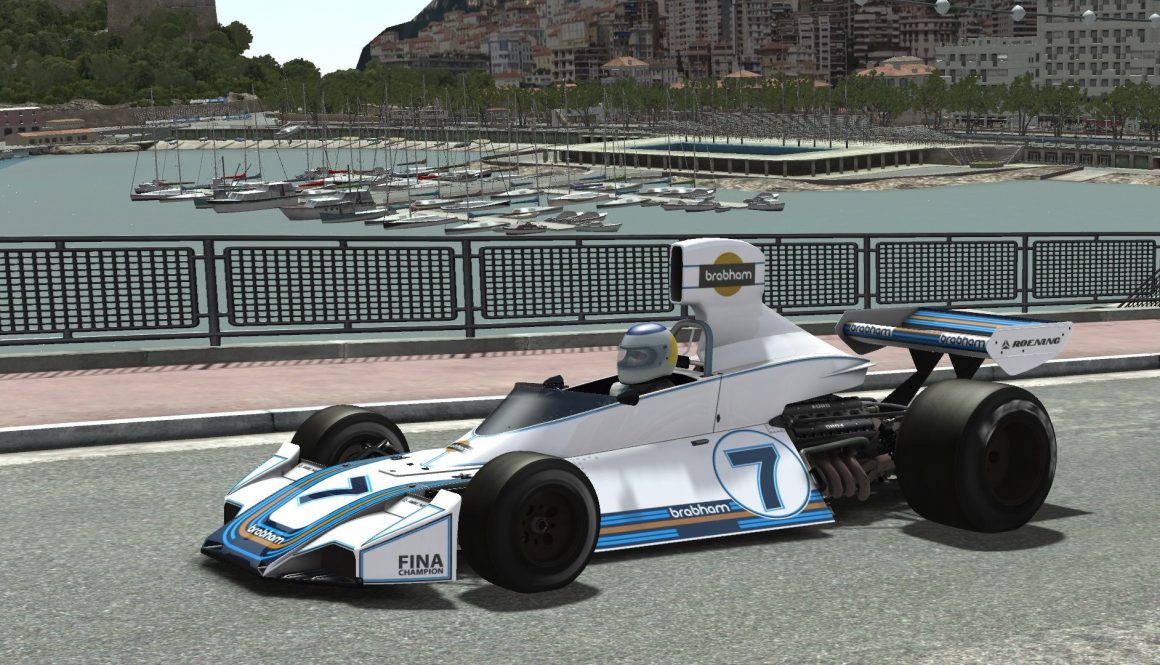
In part one, we mostly defined some generalized things about tyres, and a very basic implementation with the spreadsheet. Part II will go further into implementation. The final part, will cover mostly real time parameters and optimizations. Previously, we got as far as producing a ‘theoretical’ tyre in the spreadsheet, but never ran it in +tTool. Though, a ‘completed’ tyre is already in the V0.66 Brabham BT44B available on Steam, it should be noted that it is still a placeholder tyre. I never expect the first attempt to be the final attempt, either. Nor the second if I’m honest. It is rather difficult without trying it in-game (or at least in the ttool real-time model) to know how the tyre will react. Inevitably, we do need our tyre lookup table built up to help us make future improvements. Not all is doom and gloom, we can improve our odds by looking at some general properties.
Before I get started, David Wright had pointed me to a couple references in the comments of the previous blog entry. These confirmed some things and but also made me reconsider some design elements of these particular tyres. For one, the cord density was supposedly 25-30 strands per inch. This works out to a ‘strand spacing’ of 0.0254/25 = 0.001016m (1.016mm) to 0.0254/30 = 0.000847m (0.847mm). If we stick with our previous assumption of protective rubber coatings filling in about 50% of that gap, that would give us a strand diameter range of about 0.847/1.5=0.564mm to 1.016/1.5=0.677mm. I had previously used ‘24.2’ per inch but this also made them too thick as a result. The end result is not too dissimilar in this situation, anyway.
Design considerations
In general the best way to learn is via experimentation. A few rules or guidelines can be picked up, and of course reading existing materials out there is also highly beneficial. So this time, I’m going to be mostly looking at the analytical options that tTool provides.
Shape & Contact Patch Pressure Distribution
Last time around, I explained that we should shape the general tyre to match the dimensions of the real tyre. In the end, one of the goals of a tyre designer will be to create a smooth even contact patch pressure distribution. This essentially means the footprint of the tyre should have the no points where the pressure significantly varies from another. In tTool these loads are shown as blue vertical lines (if your tyre nodes are evenly spaced, they will correlate well with pressure). They appear in tTool as below;

How a tyre contact patch appears up in the QSA section of tTool.
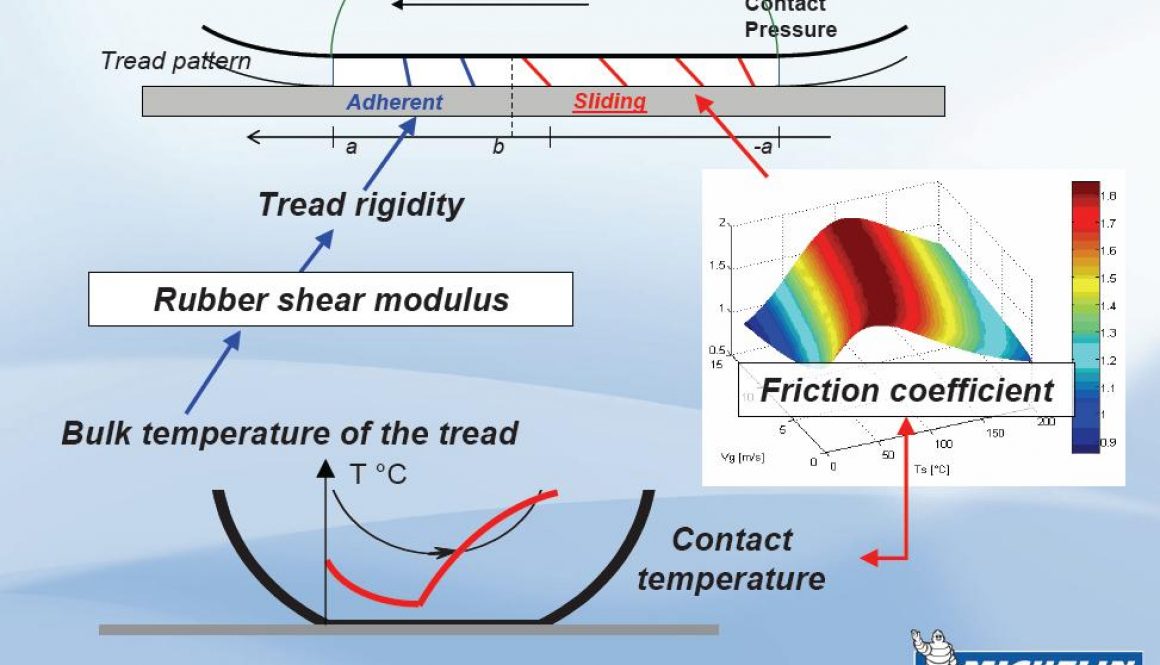
A tyre design will always have some trade-offs, though, which don’t allow the contact patch to be completely even throughout. To add an additional err of complexity, the trailing edge is also the most important when it comes to temperature. The rear of the contact patch is dominant when it comes to heating because the sliding speed is highest. So despite the load reducing at the rear of the footprint, we tend to see any disparity here will cause the majority of temperature anomalies in a tyre.
From this we can gather that, as a generality, a shorter and wider contact patch will create less friction heating than that of a tyre with a long contact patch. As such, if any of our tyre segments appear to be generating too much heat, we need to manipulate the tyre such that the trailing edge has a flatter pressure distribution. If our overall tyre is generating too much sliding heat in the corners or not enough, we could attempt to change the shape of the contact patch, either extending or shortening it. It’s not always black and white though, as the main source of tyre cooling is also contact conductance (ground contact, essentially). In order to lengthen a contact patch, the tyre must be made narrower or softer. This means a greater level of distortion in a relatively small space, further increasing heat generation. If our tyre dimensions are correct, the only thing left to tinker with will be the stiffness / construction properties (assuming we have a target internal tyre pressure). People might have noticed that the V0.66 version of the Brabham actually had excessive heating on the outer edges of the tyre. It’s not always a straightforward thing to correct. None the less, it can usually be achieved with subtle shape changes, by decreasing the radius of nodes that correspond have too much contact pressure.
Prior to generating the full lookup table, which takes many hours. We can analyze a tyre’s contact patch, using tTool. We’ll simply need to run a few deflection tests in the quasi-static model. After loading our .tgm file in tTool, we need to configure the gauge pressure, temperature and rotation to something plausible, conditions you would specifically like to check. Assuming the tyre is suspended above the ground plane you should have ‘Symmetric Test’ enabled, as this could speed up the test by about 200x (or how ever many tyre sections you have defined). This is useful only for tests where you are not deflecting the tyre, because it assumes the tyre forces are even the whole way around the tyre. Now click ‘number of iterations per frame’ and enter something like 500. After a couple dozen seconds or so, the tyre test will be ‘100%’. You can pause the test at this point by pressing ‘Perform One Iteration’. Now take a mental note of the ‘peak radius’. We’re targeting a plausible deflection, so let’s say we want a 7mm deflection and the radius is 0.255m. We’d want to set the ‘Ground Height’ to -0.248m (negative as the patch is below the tyre center). Make sure to unselect ‘Symmetric Test’. Now set iterations per frame to something like 9, press CTRL+D to disable graphics (this will speed things up a little bit), you’ll have to wait some minutes. The first meaningful results will come in when the percentage done reaches about 30%, but the shape of the contact patch will keep subtly changing until you reach 80% or higher. In other words, in the early design stages of your tyre, you don’t have to wait until this test is 100% complete. You will already be able to spot some patterns in the contact patch that require the tyre to be adjusted. In order to examine the tyre adjust the camera, to view the tyre patch from the side, and focus on the ground plate. You can manipulate the camera by pressing CTRL+Numpad keys, and CTRL+ALT for more precise adjustments. One of the best positions to view the patch is mostly from the side, zoomed in as far as possible (CTRL+Numpad3), CTRL+Arrow keys also help to position the camera. Which may look something like:
A tyre contact patch and corresponding loads, with some room for improvement.
In this tyre, the contact patch is loaded too much on the outside, requiring either more pressure or a higher rotation speed to flatten the contact patch. As a designer, your duty will be to make the contact patch as smooth as possible, over different conditions that the tyre will see during track use. Such as high load, high speed corners and low speed corners alike. Of course, in reality, there is no such thing as an optimum pressure for a tyre. This is highly load dependent, so you will have to keep this in mind as you design your tyres. This is part of what makes tyre design an iterative process. Inevitably, when you think you have optimized a tyre, you will be able to make an even better version in the future. Just to note, a special emphasis should be placed under conditions you’d see in cornering. For example, the default front camber on the BT44B is 1.5 degrees. The typical load for an outside tyre is about 2500N, the grip coefficient at this load is about 1.5. This gives a lateral force of 3750N.
Another tyre:
A different type of tyre and some plausible conditions under which it was tested.
The most important configurable aspects of this tyre have been highlighted. For this street car, loads are typically seen around 1900N on the outside tyres. The grip coefficient is also around 1, meaning a lateral force of ~1900N (ok I went slightly over). The optimum warm pressures are around 160kPa, and the tyre typically sees about 80�C during track use. The typical camber setup is around 1.8 degrees too. Camber is a somewhat difficult attribute to determine though, because the optimum cambers will vary, and the actual camber of the wheel changes due to suspension geometry, body roll and even flex. Still, this gets us in the ballpark. Interestingly, the lateral flex / spring rate for most tyres is actually similar or slightly softer than the vertical spring rate for that tyre. So I was nearly able to guess the distortion required to record a specific lateral force. The easier way to specify the correct lateral force is to type a “Patch Test Force X” value, but entering a “Patch Goal CG X”, typically returns a result slightly faster.
Vertical Stiffness
Vertical stiffness is a product primarily of the tyres construction properties. Mainly the thickness and type of materials used, however ply angles also bare significant influence. As a generality, a more laterally laid ply will grow more with both rotation rate and tyre pressures, while producing an overall stiffer tyre. As with any ‘rule’ there are exceptions as you reach toward either extremity the situation may completely reverse. It also gets more complicated as you add additional ply layers. For example, a 0 degree belt will severely inhibit growth of the tyre, retaining its original shape much more closely. In the end it will also produce a softer tyre when faced with pure vertical or lateral forces. Though I’m not aware of any such tyre, in theory, if you placed a 90 degree belt in the tyre, this would also produce quite a soft tyre. In contrast, this is mainly because the construction will be incapable of maintaining the tyres’ original shape. It will grow significantly with pressure & rotation producing a narrower contact patch resulting in a tyre with a soft initial spring rate that increases significantly with deflection. You’d essentially end up with a significant arc in the crown section, and mainly due to the small size of the contact patch, the tyre will be quite soft. The strongest construction angles would be at approximately 45 degrees, as this distributes any forces over the largest possible area.
Translating the QSA model to the Realtime model (Another Spreadsheet!)
In the previous blog entry, I mentioned that we’re using a brush model with a 6-DOF rigid ring. The nature of this model means that we need the bristles to flex independently of the ring, which in itself is infinitely stiff (this is common practice, as it saves on processor time). This flex model is done through the contact patch tests for vertical deflections, but requires the following the parameters for the lateral and longitudinal flex model. The parameters are provided by the following values from under the [Realtime] section:
BeltSpringX=(<base>,<per_unit_pressure>,<per_unit_ temperature>,<per_unit_rotation_squared>)
BeltSpringZ=(<base>,<per_unit_pressure>,<per_unit_ temperature>,<per_unit_rotation_squared>)
TreadSpringXPerUnitArea=(<base>,<per_unit_pressure >,<per_unit_temperature>,<per_unit_rotation_square d>)
TreadSpringZPerUnitArea=(<base>,<per_unit_pressure >,<per_unit_temperature>,<per_unit_rotation_square d>)
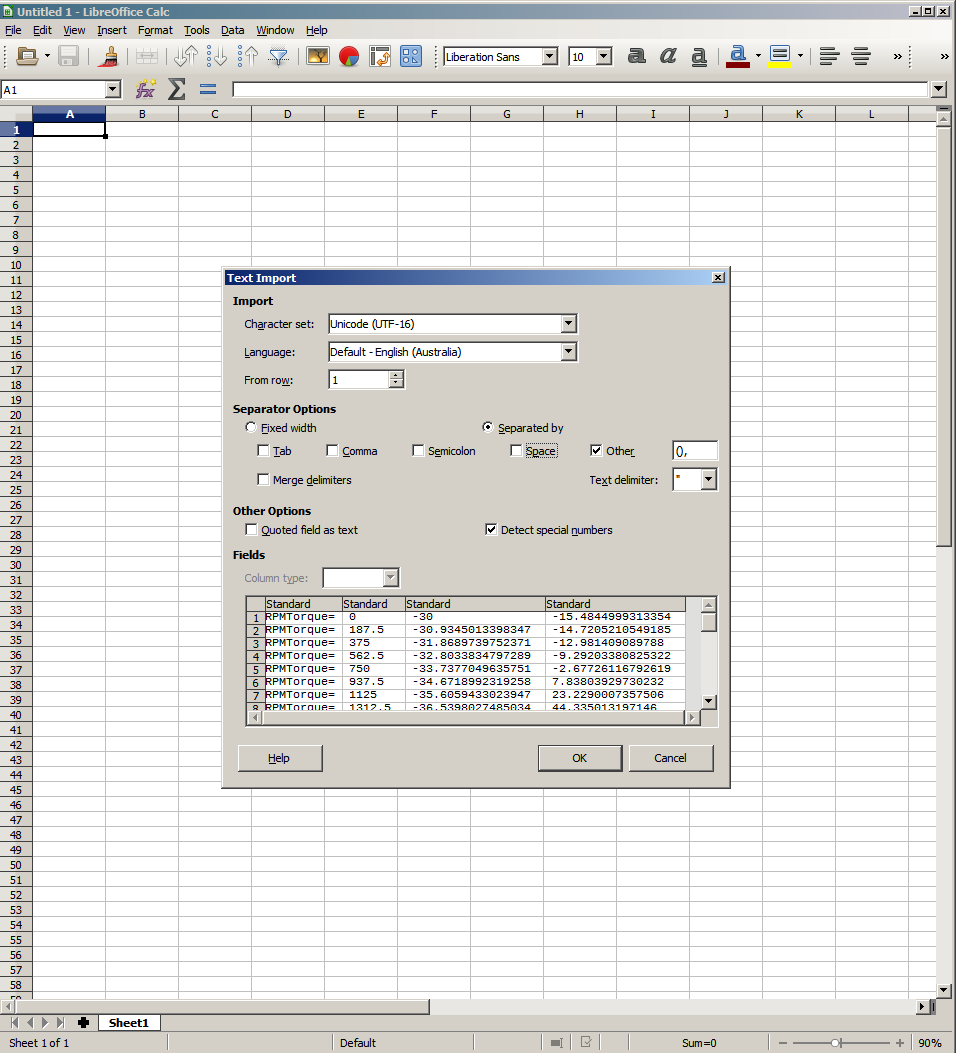
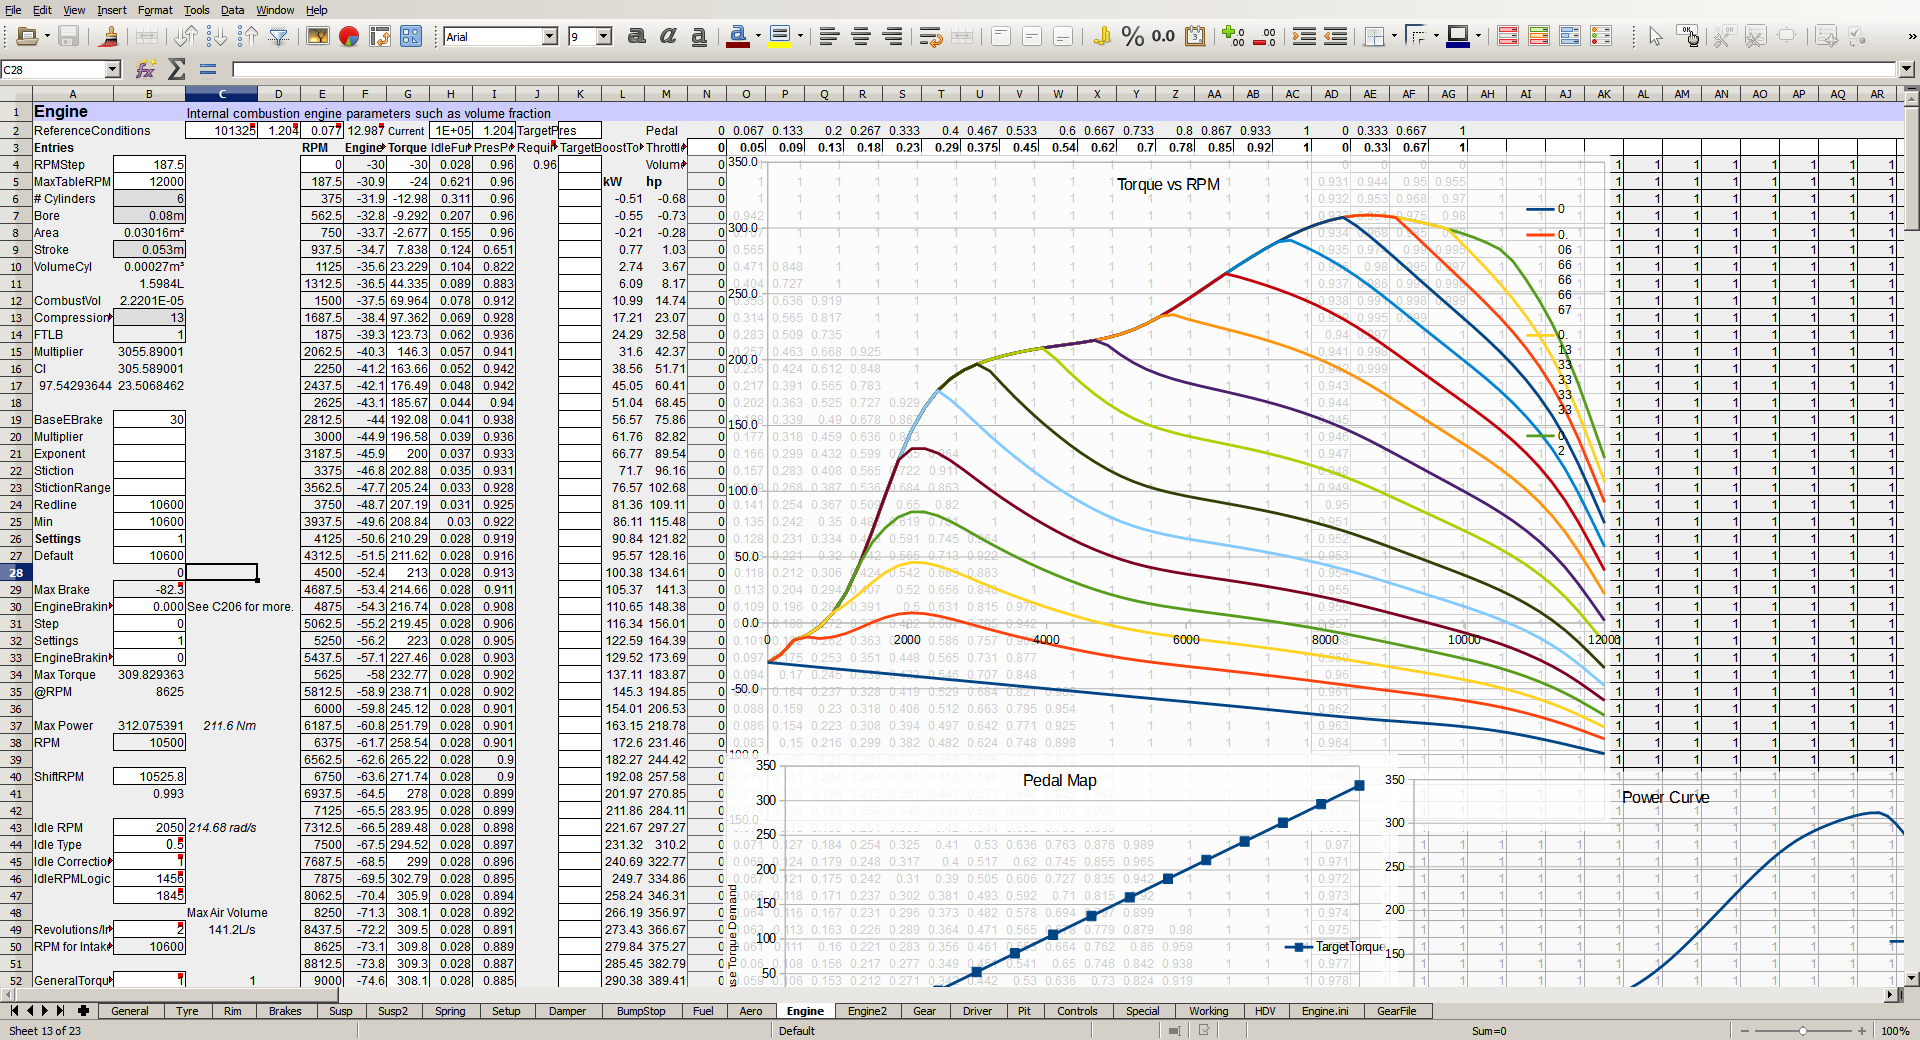
In order to come up with reasonable figures for certain parameters, +tTool had introduced batch tests some time ago. To generate meaningful data from the batch tests, we have a new spreadsheet which is called “QSA Batch Tester V0.26 – BT44 Rear.ods“. You can grab this from dev corner on rFactor.net.
QSA Batch Tester Spreadsheet
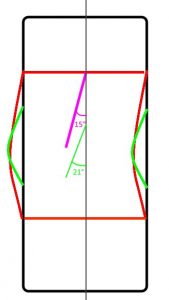
Upon opening the spreadsheet, you’ll hopefully notice “Information Desk:” on the first sheet. This is a sort of step by step guide explaining its usage. Though I will further elaborate here on what it does, and how to use it. The spreadsheet is a way to generate a set of conditions in what to test a tyre in the QSA section. The Quasi-Static model is a very high detail stiffness model. Friction data is not simulated in this model rather, physical tyre dimensions, mass, inertia and stiffness is. While friction, wear, and thermodynamic properties are defined entirely within the realtime model (though thermodynamics are dependent on the QSA model too). The ‘QSA Batch Tester’ spreadsheet is prefilled with values designed to measure the lateral and longitudinal stiffness of the tyre, and how it varies over various conditions. These tests are rather slow and will take several hours to compute on most machines, so you might want to run them overnight or in the background. In short, the peak slip angles are dictated by the tyres overall stiffness, and also how the compound reacts to temperature. For those familiar with tuning the old rF1 .TBC tyre file, the bristle spring rates can be tuned in a similar way to adjusting the LatPeak= values. If you soften the spring rates, the peak slip angles will be higher. If you want the peak slip angle lower at high loads but similar at lower loads you’d typically reduce the ‘tread’ stiffness value and increase the belt stiffness. This defeats the purpose of using QSA data to build up stiffness tables though, but it can be useful in determining whether the tyre construction properties need altering. i.e. if a desired peak slip angle is say, 9 degrees, and your current tyre provides about 7 degrees then the tyre stiffness will need to be decreased to approximately tan(7)/tan(9). So we could then use that knowledge to tune our tyre to be that much softer in our next version. However, like with most things, care will then be needed to make sure this does not overly soften the tyre vertically. In such a scenario, the contact patch will be longer, which then may require the tyre to be even softer to keep the peak slip angle higher. All things being equal, it might look something like:
The angles are hypothetical, the fact that the contact patch is spread over a greater area effectively increases its spring rate. This is due to the fact that more bristles will be in contact with the ground. The end result is that the angle is far steeper because the patch is both shorter, and more distorted.
The next part covering tyres will be the last major one, mostly covering the Realtime model. It will be paired with yet another spreadsheet release, for generating Realtime batch tests. These tests can be used to build up friction curves, or other curves as desired.

